📈 Analytics
Show your website's visitor statistics in the admin: a dedicated analytics page, the statistics of the object being edited, and widgets for the dashboard. Content Studio reads them from your analytics tool through a provider. It ships one for Umami, and you can write your own for another tool.
Set up analytics
Add an AnalyticsExtension with a provider to your site's extensions, and
an AnalyticsPage with a link to it:
# mysite/studio.py
from django.conf import settings

from content_studio.admin import ContentStudioSite
from content_studio.analytics import (
    AnalyticsExtension,
    AnalyticsLink,
    AnalyticsPage,
    UmamiProvider,
)


class BlogStudioSite(ContentStudioSite):
    extensions = [
        AnalyticsExtension(
            provider=UmamiProvider(
                website_id=settings.UMAMI_WEBSITE_ID,
                api_key=settings.UMAMI_API_KEY,
            ),
        ),
        AnalyticsPage(),
        AnalyticsLink(),
    ]


admin_site = BlogStudioSite()
The main menu then shows Analytics, which opens the analytics page. Every active staff user sees the analytics; to narrow that down, see Who sees analytics.
The AnalyticsExtension takes:
provider: the provider that reads the statistics.cache_timeout: how long, in seconds, the statistics are cached in Django's cache, so that editors opening the same report do not each ask the analytics tool.300by default.realtime_cache_timeout: the same for the number of visitors online now.30by default.
Umami
UmamiProvider reads a website's statistics from Umami Cloud or from your
own Umami server, with an API key:
# Umami Cloud: create an API key under Settings > API keys.
UmamiProvider(website_id="4fb7...", api_key="api_...")

# Your own Umami server: an API key from the server's settings.
UmamiProvider(
    url="https://umami.example.com",
    website_id="4fb7...",
    api_key="umami_...",
)
It takes:
website_id: the website's ID, from its settings in Umami.api_key: the API key. Keep it out of your code, in a setting read from the environment.url: your Umami server's address. Leave it out for Umami Cloud.dashboard_url: where Open in Umami goes. On your own server it is the website's page there; for Umami Cloud, set it to show the button.
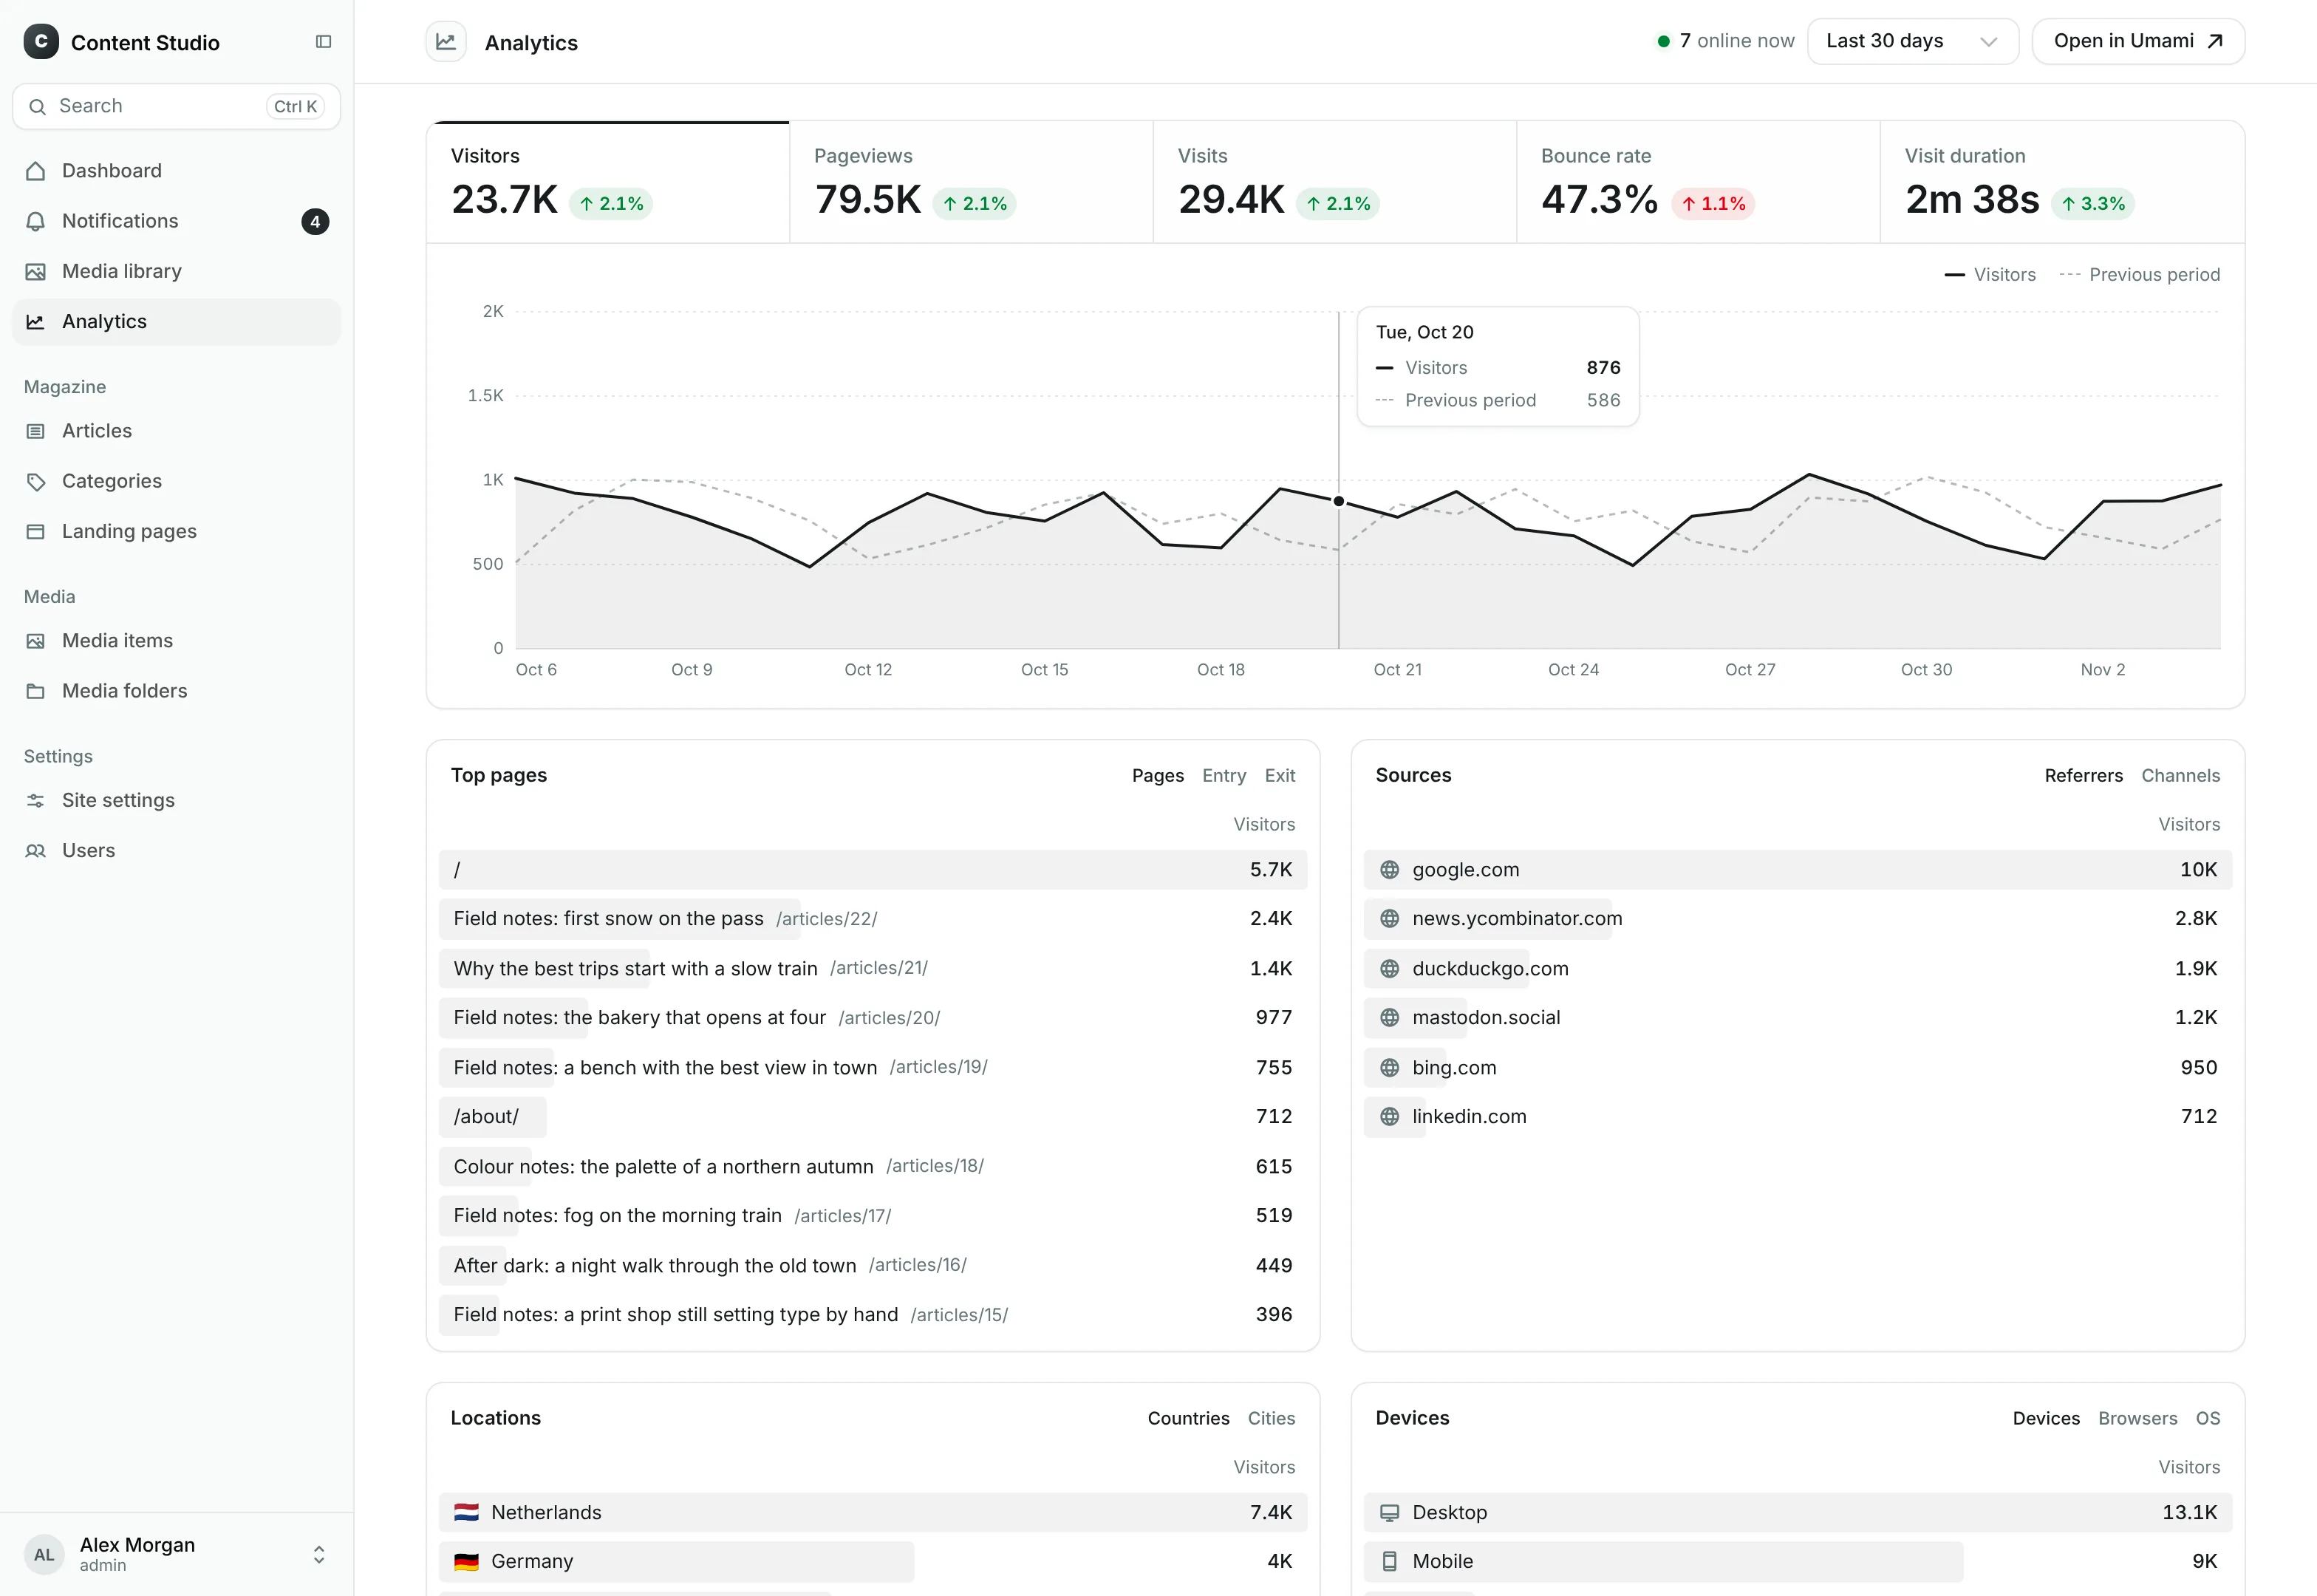
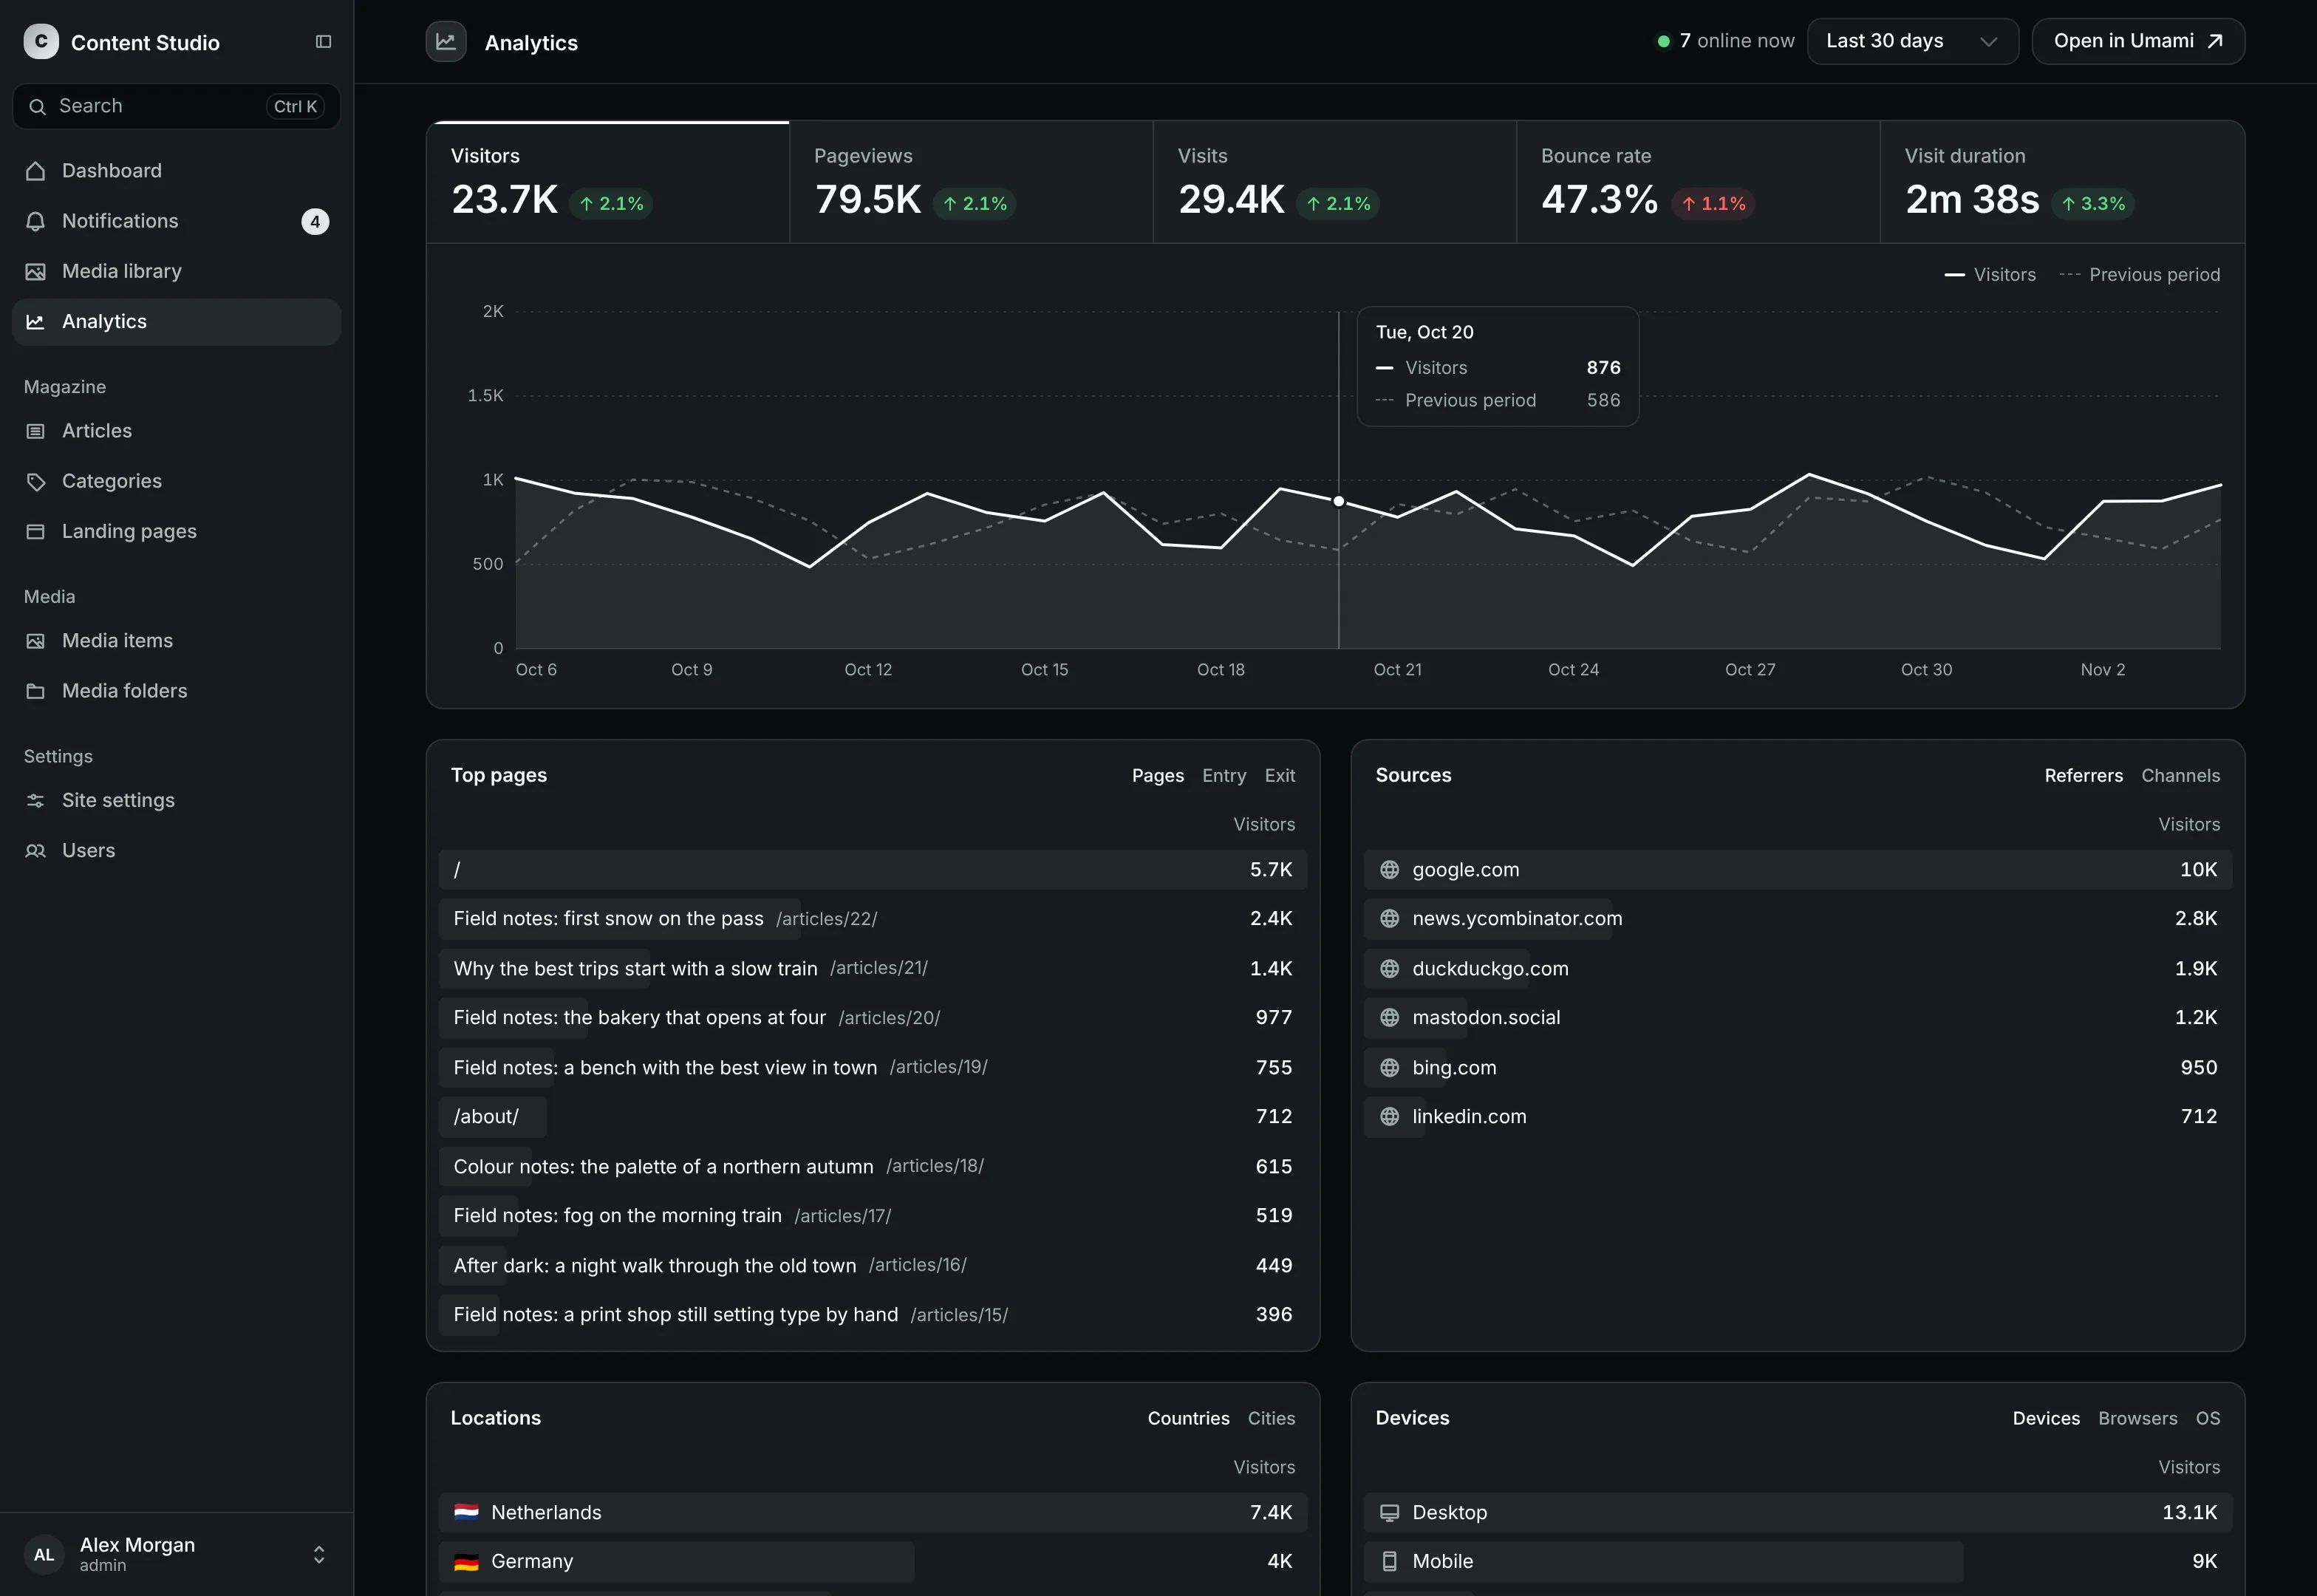
Umami reports visitors, pageviews, visits, bounce rate and visit duration, and breaks visitors down by page, entry and exit page, referrer, channel, campaign, country, region, city, device, browser and operating system.
To show each tenant its own website on a
multi-tenant site, subclass the provider and
override get_website_id(request).
The analytics page
The analytics page compares the site's metrics with the period before, charts them over time, and lists the top pages, sources, locations and devices. The period is today, the last 7, 30 or 90 days or 12 months, or a range of dates. A page's statistics show when you open the page in the top pages, or follow Full report from an object.
The period and the page are in the address, so a report can be shared.
AnalyticsPage takes a path ("analytics/" by default), a title and a
description.
Links
AnalyticsLink adds the analytics page to the main menu and
AnalyticsUserMenuLink to the user menu. Both take the options of a
MainMenuLink, and link to the analytics
page unless you give them a url:
from content_studio.analytics import AnalyticsUserMenuLink

extensions = [
    # ...
    AnalyticsPage(),
    AnalyticsUserMenuLink(label="Statistics"),
]
The statistics of an object
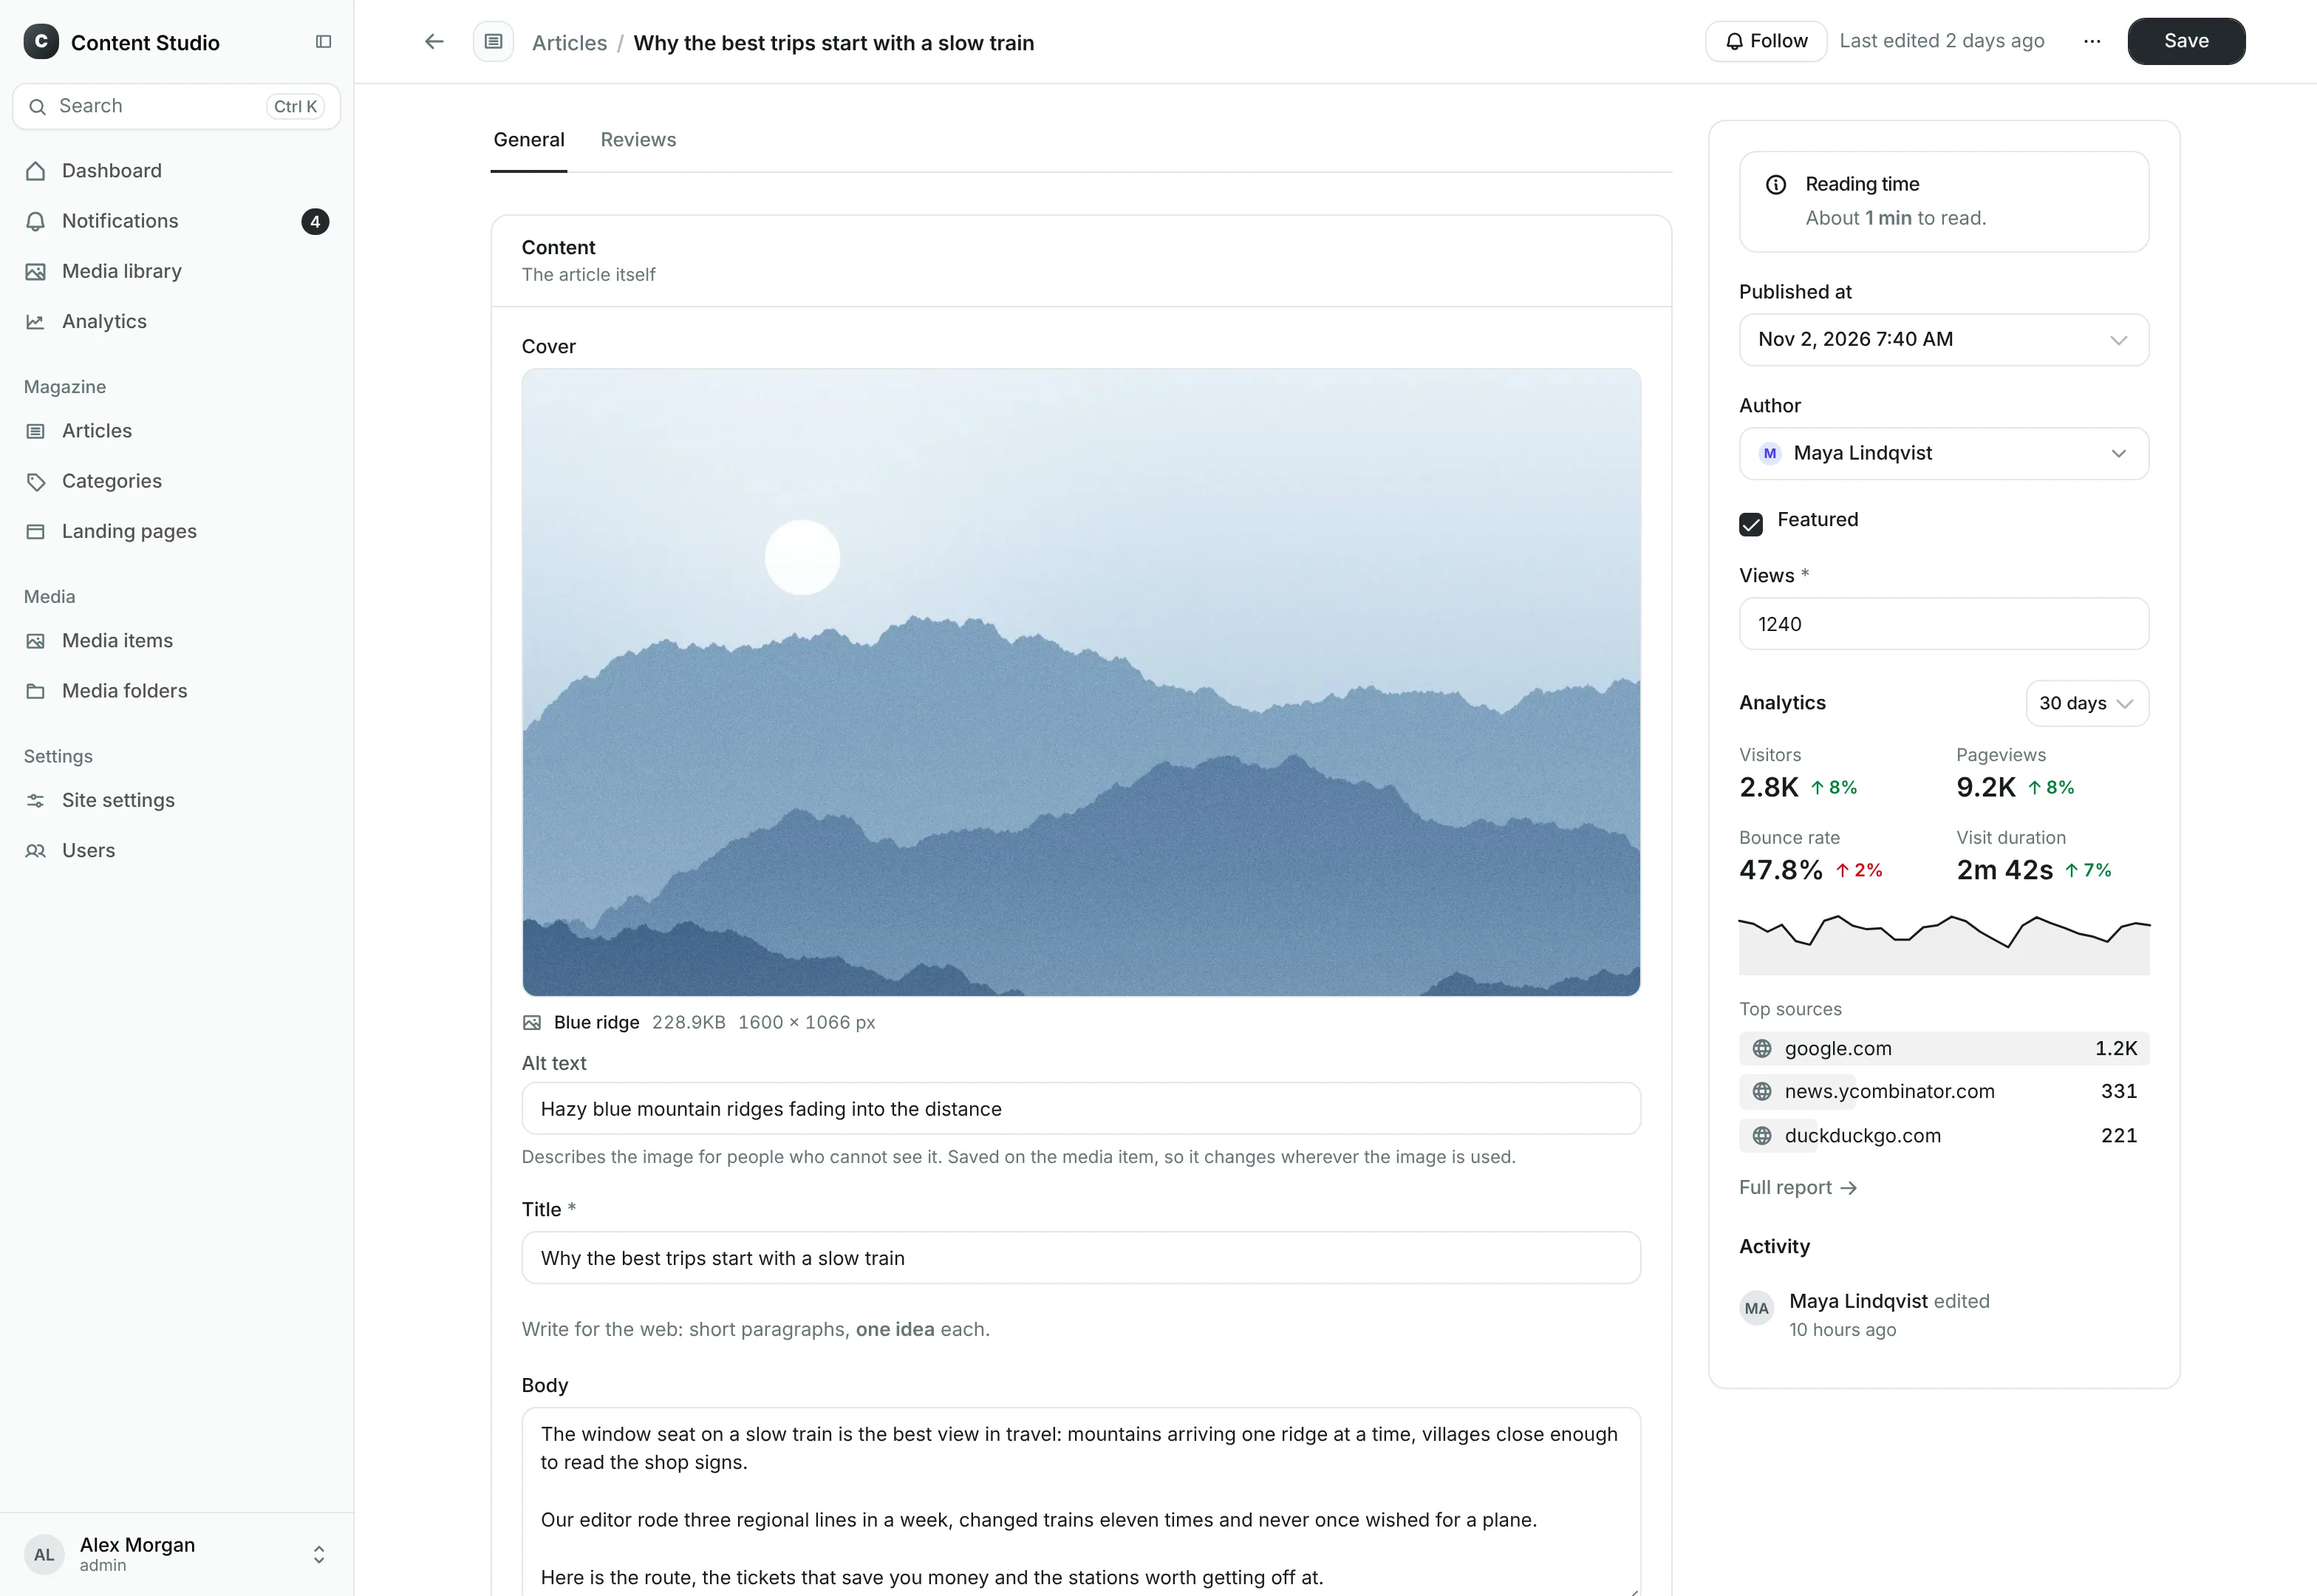
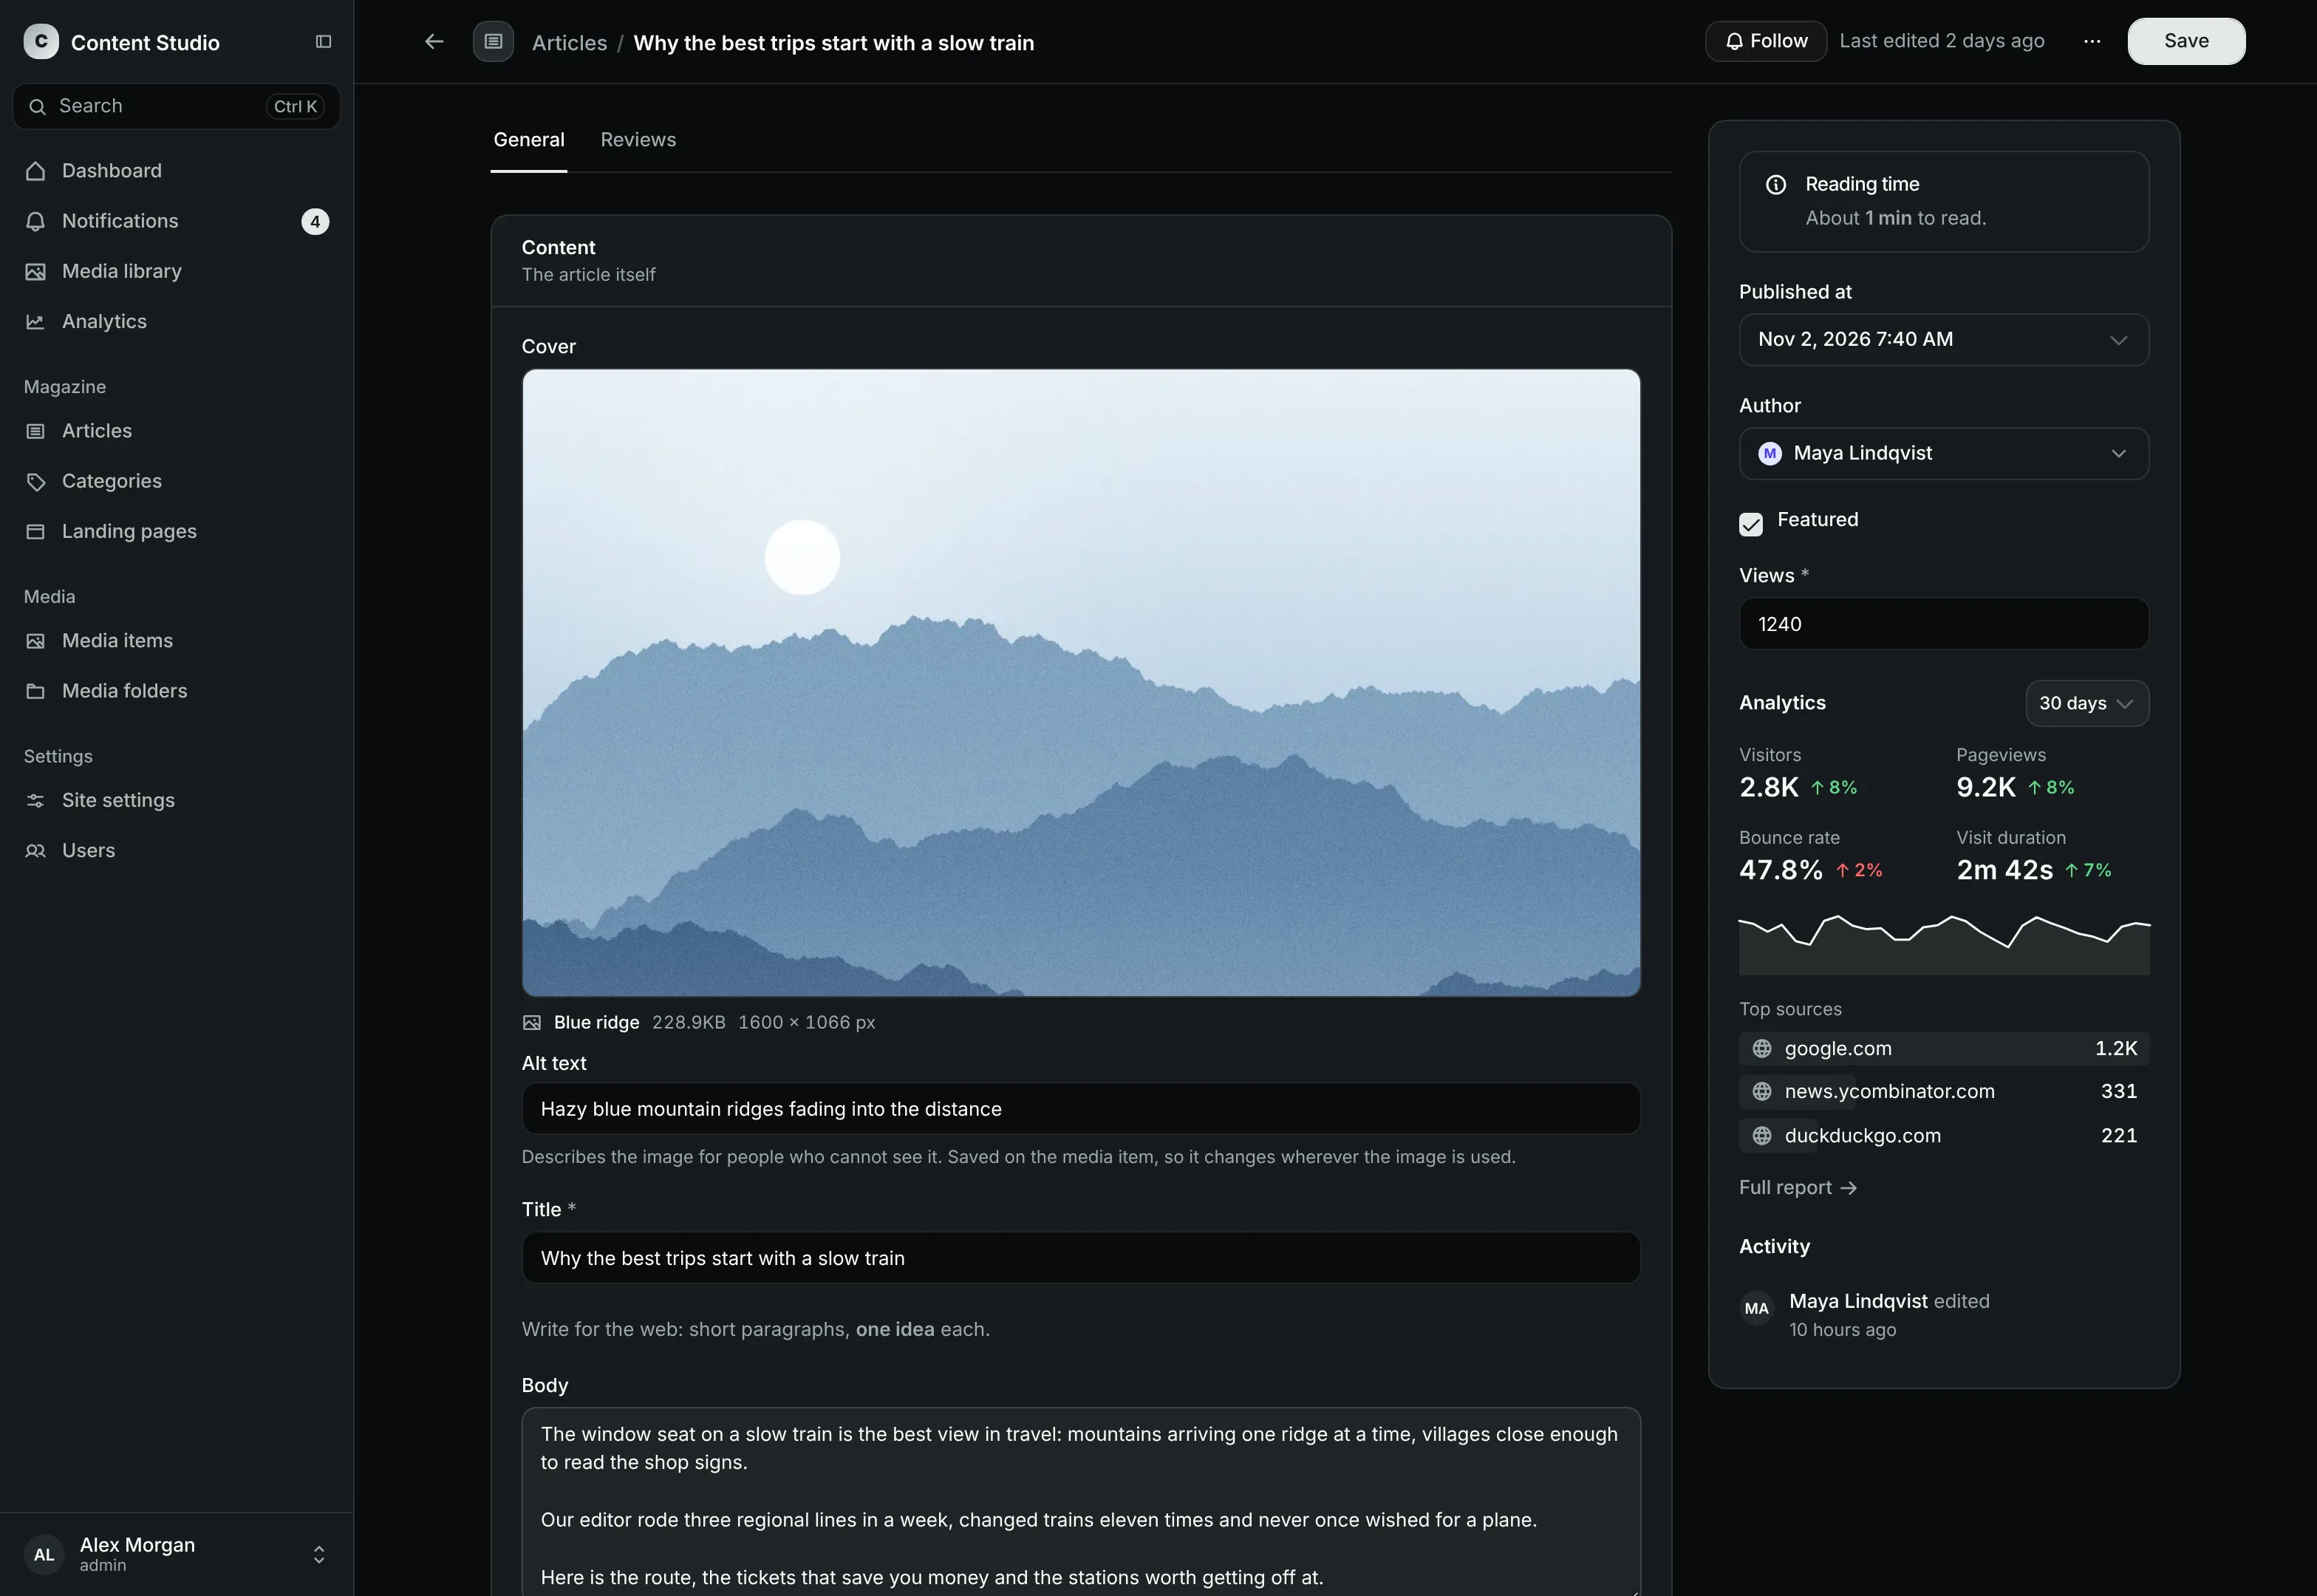
The Analytics component shows the statistics of the edited object's page on
your site. In edit_sidebar it shows four numbers, a chart and the top
sources; in edit_main the full report:
# blog/admin.py
from content_studio import register
from content_studio.admin import ModelStudio
from content_studio.analytics import Analytics


@register(Article)
class ArticleStudio(ModelStudio):
    edit_main = ["title", "body"]
    edit_sidebar = [
        "published_at",
        Analytics(path_field="slug", path_prefix="/blog/", path_suffix="/"),
    ]
The component finds the object's page from path_prefix, the value of
path_field and path_suffix, so the article with the slug slow-trains
above is /blog/slow-trains/. Without path_field, it uses the path of the
object's get_absolute_url(). An object without a page, such as an article
without a slug, shows a note instead.
With path_field, the analytics page's top pages and the top pages widget
link to the objects they show, for the editors who may view them.
Analytics also takes a title, a layout ("compact" or "full" to
choose one wherever it is placed) and a default_range ("30d" by default).
For pages that a field cannot describe, override get_path(obj, request),
and get_objects(paths, queryset, request) to keep the links:
class ArticleAnalytics(Analytics):
    def get_path(self, obj, request):
        return f"/{obj.published_at:%Y/%m}/{obj.slug}/"

    def get_objects(self, paths, queryset, request):
        slugs = {path.rstrip("/").rsplit("/", 1)[-1]: path for path in paths}
        return {
            slugs[article.slug]: article
            for article in queryset.filter(slug__in=slugs)
        }
Dashboard widgets
Two widgets show analytics on the dashboard:
from content_studio.analytics import (
    AnalyticsStatisticWidget,
    AnalyticsTopPagesWidget,
)
from content_studio.dashboard import Dashboard

dashboard = Dashboard(
    widgets=[
        AnalyticsStatisticWidget(metric="visitors"),
        AnalyticsStatisticWidget(metric="bounce_rate", range="7d"),
        AnalyticsTopPagesWidget(limit=5),
    ],
)
AnalyticsStatisticWidget shows one metric (visitors, pageviews,
visits, bounce_rate or visit_duration) with its change against the
period before and a chart. AnalyticsTopPagesWidget lists the most visited
pages, linked to their objects. Both take a range ("today", "7d",
"30d", "90d" or "12mo"; "30d" by default) and a title, and refresh
every five minutes.
Who sees analytics
Every active staff user sees the analytics page, the component and the
widgets. To show them to some users only, subclass the extension and override
is_visible(request):
class StaffAnalytics(AnalyticsExtension):
    def is_visible(self, request):
        return request.user.groups.filter(name="Marketing").exists()
The Analytics component also needs permission to view the object.
When the analytics tool is down
Content Studio asks the analytics tool when an editor opens a report; the Umami provider waits five seconds for an answer. When none comes, the reports say the statistics are unavailable and offer to try again; the rest of the admin is unaffected.
Write a provider
To read the statistics from another tool, such as Plausible or Matomo,
subclass AnalyticsProvider and implement what the tool supports:
from content_studio.analytics import (
    AnalyticsError,
    AnalyticsProvider,
    BreakdownRow,
    MetricValue,
    TimeseriesPoint,
)


class PlausibleProvider(AnalyticsProvider):
    name = "Plausible"
    metrics = ("visitors", "pageviews", "bounce_rate", "visit_duration")
    timeseries_metrics = ("visitors", "pageviews")
    breakdowns = ("pages", "referrers", "countries", "devices")

    def get_summary(self, request, query):
        # query.start and query.end are aware datetimes, query.path the page
        # (or None), query.previous the period before.
        ...
        return {"visitors": MetricValue(1200, previous=1000), ...}

    def get_timeseries(self, request, query, metric):
        # One point per query.buckets(), by query.interval (hour, day or month).
        ...
        return [TimeseriesPoint(date=bucket, value=40, previous=30), ...]

    def get_breakdown(self, request, query, dimension, limit):
        ...
        return [BreakdownRow(key="/blog/slow-trains/", value=310), ...]

    def get_realtime(self, request):
        return 7

    def get_dashboard_url(self, request, query):
        return "https://plausible.io/example.com"
Raise AnalyticsError when the tool cannot be reached, and the reports say
the statistics are unavailable. The page and the component leave out what a
provider does not implement, such as the live count without get_realtime.
When one provider serves several websites, override get_cache_key(request)
so that they are cached apart, and check() to report a missing setting as
a system check warning.